Environment (E) Related Numerical Objectives and Actual Performance


Based on our ESG policy, we have established environmental performance goals and monitor actual performance for our real estate portfolio.
| Monitoring item | Unit | Base year (2019) |
2020 Actual |
2021 Actual |
2022 Actual |
2023 Actual |
2024 Actual |
Target year | ||
|---|---|---|---|---|---|---|---|---|---|---|
| FP7+FP8 | FP9+FP10 | FP11+FP12 | FP13+FP14 | FP15+FP16 | FP17+FP18 | FP29+FP30 | ||||
| Secondary energy quantity | MWh | 4,277.72 | 6,819.91 | 7,555.65 | 8,396.38 | 8,088.03 | 7,773.61 | - | ||
| Energy consumption intensity | MWh/㎡ | 0.02733 | 0.02628 | 0.02036 | 0.02175 | 0.02102 | 0.02038 | 0.02460 | ||
| Reduction Rate (vs. Base year) | % | - | ▲ 3.8% | ▲ 25.5% | ▲ 20.4% | ▲ 23.1% | ▲ 25.4% | ▲ 10.0% | ||
| Compared to the previous year | % | - | ▲ 3.8% | ▲ 22.5% | + 6.8% | ▲ 3.3% | ▲ 3.1% | |||
| Note) | Activity unit denominator: Total floor area (㎡) adjusted for operating months. |
|---|
| Monitoring item | Unit | Base year (2019) |
2020 Actual |
2021 Actual |
2022 Actual |
2023 Actual |
2024 Actual |
Target year | ||
|---|---|---|---|---|---|---|---|---|---|---|
| FP7+FP8 | FP9+FP10 | FP11+FP12 | FP13+FP14 | FP15+FP16 | FP17+FP18 | FP29+FP30 | ||||
| GHG Emissions | Unit | Base year | 2020 | 2021 | 2022 | 2023 | 2024 | Target year | ||
| Scope 1 | CO2 | t-CO2e | 99.62 | 451.25 | 767.39 | 779.76 | 710.74 | 733.24 | - | |
| Non-CO₂ gases | t-CO2e | - | - | - | 11.50 | 42.60 | 504.60 | |||
| Scope 2 | Location-based approach | t-CO2e | 1,976.06 | 3,045.61 | 3,284.18 | 3,648.14 | 3,537.32 | 3,298.55 | - | |
| Market-based approach | t-CO2e | 2,140.37 | 3,192.64 | 3,597.51 | 3,795.73 | 3,464.19 | 3,349.52 | - | ||
| Scope 1+2 | Total (excl. Non-CO2 gases) | t-CO2e | 2,075.68 | 3,496.87 | 4,051.57 | 4,427.90 | 4,248.06 | 4,031.80 | ||
| Scope 1+2 | Total | t-CO2e | 2,075.68 | 3,496.87 | 4,051.57 | 4,439.40 | 4,290.66 | 4,536.40 | - | |
| Scope 1+2 emission intensity (excl. Non-CO2 gases) | t-CO2e/㎡ | 0.01326 | 0.01347 | 0.01092 | 0.01147 | 0.01104 | 0.01057 | 0.01194 | ||
| Reduction Rate (vs. Base year) | % | - | + 1.6% | ▲ 17.7% | ▲ 13.5% | ▲ 16.7% | ▲ 20.3% | ▲ 10.0% | ||
| Compared to the previous year | % | - | + 1.6% | ▲ 19.0% | + 5.1% | ▲ 3.7% | ▲ 4.3% | |||
| Note) |
Non-CO₂ gases: CH₄, N₂O, HFCs, PFCs, SF₆, NF₃ Scope 1+2: Total based on location-based approach Intensity denominator: Total floor area (㎡), adjusted for months of operation |
|---|
| Monitoring item | Unit | Base year (2019) |
2020 Actual |
2021 Actual |
2022 Actual |
2023 Actual |
2024 Actual |
Target year | ||
|---|---|---|---|---|---|---|---|---|---|---|
| FP7+FP8 | FP9+FP10 | FP11+FP12 | FP13+FP14 | FP15+FP16 | FP17+FP18 | FP29+FP30 | ||||
| GHG emission | Unit | Base year | 2020 | 2021 | 2022 | 2023 | 2024 | Target year | ||
| Scope 3-1 | Purchased goods and services | t-CO2e | 322.54 | 609.64 | 916.14 | 951.90 | 969.84 | 998.90 | - | |
| Scope 3-2 | Capital goods | t-CO2e | 35.88 | 697.37 | 180.53 | 205.74 | 736.78 | 599.60 | - | |
| Scope 3-5 | Waste generated in operations | t-CO2e | 724.82 | 992.35 | 1,753.22 | 1,691.63 | 1,910.75 | 2,011.08 | - | |
| Scope 3-13 | Downstream leased assets | t-CO2e | 8,316.61 | 11,403.74 | 15,904.36 | 16,974.68 | 19,601.80 | 22,900.73 | - | |
| Data coverage rate | % | 84.35% | 74.14% | 76.56% | 79.02% | 83.75% | 84.35% | - | ||
| Scope 3 | t-CO2e | 10,124.67 | 14,695.44 | 20,507.47 | 21,515.58 | 25,129.92 | 28,521.39 | - | ||
| Scope 3 impact | % | 82.99% | 80.78% | 83.50% | 82.90% | 85.42% | 86.28% | - | ||
| GHG emission intensity | t-CO2e/㎡ | 0.06469 | 0.05663 | 0.05526 | 0.05574 | 0.06532 | 0.07477 | - | ||
| Reduction Rate (vs. Base year) | % | - | ▲ 12.5% | ▲ 14.6% | ▲ 13.8% | + 1.0% | + 15.6% | - | ||
| Compared to the previous year | % | - | ▲ 12.5% | ▲ 2.4% | + 0.9% | + 17.2% | + 14.5% | |||
| Note) |
Scope 3-1: Calculated by multiplying the emission factor specified by the Ministry of the Environment by the services received during the target period. Scope 3-2: Calculated by multiplying the emission factor specified by the Ministry of the Environment by the increase in depreciation expenses. Scope 3-5: Calculated by multiplying the emission factor specified by the Ministry of the Environment (including the transportation stage) by the amount of waste generated (by type and treatment method). Types and treatment methods: Calculated using statistical data from the Ministry of the Environment or relevant industry associations. Scope 3-13: Emissions associated with tenant business activities. Scope 3-13 Data Coverage Rate: The ratio of tenant floor area disclosed to total leasable floor area. Scope 3 Impact Ratio: The proportion of Scope 3 emissions relative to total GHG emissions. Activity Unit Denominator: Total floor area (㎡) adjusted for operating months. |
|---|
| Monitoring item | Unit | Base year (2019) |
2020 Actual |
2021 Actual |
2022 Actual |
2023 Actual |
2024 Actual |
Target year | ||
|---|---|---|---|---|---|---|---|---|---|---|
| FP7+FP8 | FP9+FP10 | FP11+FP12 | FP13+FP14 | FP15+FP16 | FP17+FP18 | FP29+FP30 | ||||
| Water | Unit | Base year | 2020 | 2021 | 2022 | 2023 | 2024 | Target year | ||
| Water usage | Water withdrawal | ㎥ | 246,244.35 | 343,764.21 | 535,825.24 | 623,842.89 | 713,926.17 | 831,356.34 | - | |
| Actual value | ㎥ | 211,762.35 | 213,165.96 | 253,979.47 | 317,888.57 | 407,543.79 | 508,155.77 | |||
| Estimated value | ㎥ | 34,482.00 | 130,598.25 | 281,845.77 | 305,954.32 | 306,382.38 | 323,200.57 | |||
| Data coverage rate (Based on water withdrawal) |
% | 86.00% | 62.01% | 47.40% | 50.96% | 57.08% | 61.12% | |||
| (Based on floor area) | % | 85.17% | 75.05% | 73.02% | 74.80% | 79.71% | 80.51% | |||
| Clean water usage intensity | ㎥/㎡ | 0.8962 | 0.7078 | 0.6654 | 0.7835 | 0.9019 | 1.0576 | ≦ 0.8962 | ||
| Reduction Rate (vs. Base year) | % | - | ▲ 21.0% | ▲ 25.8% | ▲ 12.6% | + 0.6% | + 18.0% | ±0% | ||
| Compared to the previous year | % | - | ▲ 21.0% | ▲ 6.0% | + 17.8% | + 15.1% | + 17.3% | |||
| Note) |
Estimated value: Estimated based on the Tokyo Metropolitan Government Bureau of Waterworks’ “Survey on Actual Conditions of Domestic Water Use,” using the average monthly water consumption per household by household size. Actual coverage rate (water withdrawal basis): Ratio of measured water withdrawal to total water withdrawal. Actual coverage rate (floor area basis): Ratio of floor area with measured data to the total floor area. Intensity denominator: Total floor area (㎡), adjusted for months of operation. |
|---|
| Monitoring item | Unit | Base year (2019) |
2020 Actual |
2021 Actual |
2022 Actual |
2023 Actual |
2024 Actual |
Target year | ||
|---|---|---|---|---|---|---|---|---|---|---|
| FP7+FP8 | FP9+FP10 | FP11+FP12 | FP13+FP14 | FP15+FP16 | FP17+FP18 | FP29+FP30 | ||||
| Waste | Unit | Base year | 2020 | 2021 | 2022 | 2023 | 2024 | Target year | ||
| Waste generation | t | 1,474.64 | 2,615.72 | 3,662.13 | 3,825.34 | 4,368.26 | 4,705.57 | - | ||
| Data coverage rate | % | 73.90% | 88.27% | 75.09% | 74.16% | 78.67% | 77.84% | |||
| Recycling rate | % | 32.39% | 46.07% | 39.66% | 36.95% | 35.67% | 36.16% | |||
| Waste generation intensity | t/㎡ | 0.00719 | 0.00738 | 0.00933 | 0.00951 | 0.00980 | 0.01013 | ≦ 0.00719 | ||
| Reduction Rate (vs. Base year) | % | - | + 2.7% | + 29.7% | + 32.2% | + 36.2% | + 40.8% | ±0% | ||
| Compared to the previous year | % | - | + 2.7% | + 26.3% | + 1.9% | + 3.0% | + 3.4% | |||
| Note) |
Data coverage rate: Ratio of floor area with available waste generation data to the total floor area. Intensity denominator: Total floor area (㎡), adjusted for months of operation. |
|---|
Signing of green lease contracts
Green lease is an agreement specifying that property owners and tenants shall cooperate to reduce environmental burden.
Since 2021, Star Asia Investment Corporation (“SAR”) has promoted the incorporation of Green Lease provisions upon signing lease contracts with tenants.
Ratio of green lease (※) 54.3% (As of July 31, 2025)
※Ratio of area leased under green leases to total rentable area.
Environment Preservation Investments
Efficient energy consumption and environmental preservation is being promoted mainly by the Sustainability Promotion Division, by examining the contents of construction works and specification of facilities, and renewing facilities etc. at appropriate timing and adequate specifications.
unit: thousand-yen
| Classification | Main Initiatives | 17FP (ended Jul. 31, 2024) |
18FP (ended Jan. 31, 2025) |
19FP (ended Jan. 31, 2026) |
Cumulative Amount form 11FP |
||||
|---|---|---|---|---|---|---|---|---|---|
| Capital Expenditures |
Expensed Expenditures |
Capital Expenditures |
Expensed Expenditures |
Capital Expenditures |
Expensed Expenditures |
Capital Expenditures |
Expensed Expenditures |
||
| Energy saving renovation costs |
Air-conditioning and BAS/BEMS | 125,181 | 2,666 | 124,418 | 13,960 | 183,884 | 20,641 | 1,234,813 | 124,334 |
| Installation of LED lighting | 46,000 | 575 | 81,280 | 5,020 | 32,554 | 1,932 | 409,278 | 15,769 | |
| Renovation of major equipment (delivery power, EV etc.) |
375,890 | 16,151 | 219,209 | 5,496 | 140,249 | 4,736 | 1,426,885 | 45,541 | |
| related to water resources | 12,675 | 1,077 | 4,772 | 437 | 8,294 | 628 | 25,741 | 2,142 | |
| Water conservation costs |
Maintenance of water storage tanks and septic systems | 0 | 3,940 | 0 | 3,113 | 0 | 3,738 | 0 | 10,791 |
| Greening conservation costs |
Plants refurbishment, maintenance of exterior plants |
0 | 6,185 | 0 | 13,036 | 0 | 10,837 | 0 | 63,243 |
| Total | 547,071 | 29,517 | 424,907 | 40,624 | 356,687 | 41,883 | 3,070,976 | 259,678 | |
Environmental initiatives
■Efforts in Urban Center Hakata
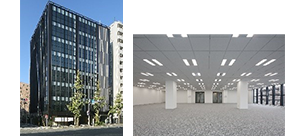
This property is the first office development project undertaken by Star Asia Sogo Kaihatsu which belongs to the Sponsor Group, and is a new multi-tenant type office building whose construction was completed.
Star Asia Group’s construction management division supervised the specifications from interior and exterior design and facilities to the final finishings, assuming the needs of the tenants entering the property.
Acquired BELS★★★
| ・ | BCP response (Install emergency-use USB ports) |
|---|---|
| ・ | Use of recycled water, rain water |
| ・ | Energy saving effect by use of automatic dimming lighting |
| ・ | Control humidity by use of desiccant outside air processing equipment |
| ・ | No-water injection humidifying which does not require installation of pipes in the exclusively owned areas |
■Promotion of LED lighting
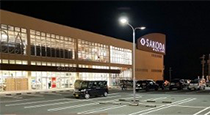
【Suroy Mall Chikushino】
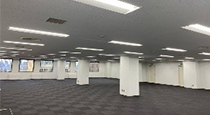
【Nishi-Shinjuku Matsuya Building】
From the perspective property operations and management caring for the environment, lighting changed to LED to suppress electricity consumption volume.